The Flowchart is Wrong Because Software is Complicated
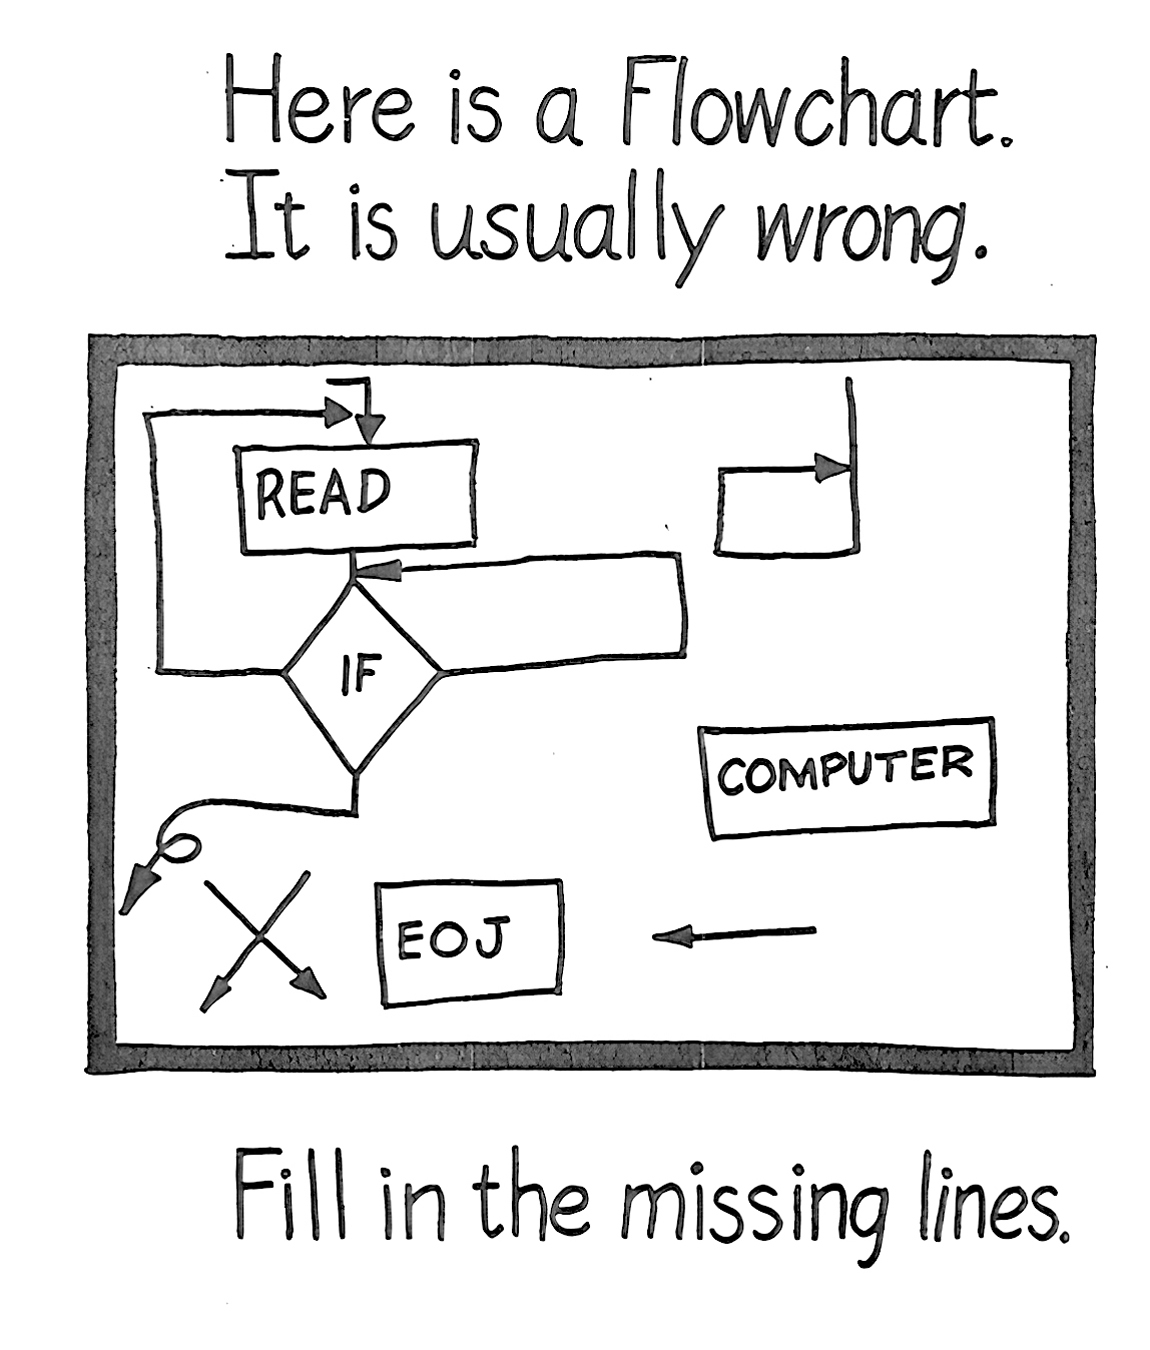
In the September 1963 issue of the data-processing journal Datamation, there appeared a small and seemingly minor cartoon: a simple program flowchart, drawn over the deadpan caption »This is a flowchart. It is usually wrong.« Every working programmer of the period would have gotten the joke instantly.
Source profile
Cartoon: »This is a flowchart. It is usually wrong.«- Journal
- Data-processing Journal »Datamation«
- Date
- September 1963
- Page
- 50
By the early 1960s the flowchart had become the central design document of software development – mandated by curriculum, standardized by national and international bodies, embodied in plastic templates and gridded worksheets, and described in textbook after textbook as the »programmer’s blueprint.« And yet, as everyone also knew, the flowchart was almost never an accurate representation of the program it was supposed to describe. Most programmers drew their flowcharts, if they drew them at all, only after the code was already written. The most reliable flowcharts were the ones produced automatically, by machine, from finished code – which is to say that the »design document« was routinely reverse-engineered from the thing it was meant to design.1
It would be easy to read this as a story about a failed technology. I want to suggest the opposite. The flowchart was one of the most durable innovations of the computer revolution precisely because it was usually wrong, and understanding why tells us something that is easy to forget at the present moment – a moment in which it has once again become common to imagine that software is essentially a body of code, and that the writing of code is a task that can be cleanly extracted from human hands and handed off to a machine.
Software is not, and has never been, simply code. It is what the sociologist John Law called heterogeneous engineering: a technology in which the writing of instructions for a machine is inseparable from the writing of instructions for, and negotiations among, people. Software is where the technology of computing meets organizational politics, professional hierarchy, corporate culture, and personal agendas. The flowchart became ubiquitous, even compulsory, in exactly this period and for exactly this reason. It was never really a blueprint. It was a boundary object – an artifact robust enough to hold a common identity across the very different worlds of the analyst, the programmer, the manager, and the end user, yet flexible enough to mean something different, and something locally useful, in each of them.2 It was a contract that protected managers against runaway programmers and programmers against runaway requirements. It was a conscription device that pulled otherwise disconnected people into a shared conversation about a system none of them could see. That a given flowchart satisfied no one entirely, and that it began to go out of date the moment it was drawn, did not make it useless. It made it the place where the real work of coordination happened.
That coordination work was never neutral, and the flowchart is one of the places where its inequalities become visible. When John von Neumann and Herman Goldstine introduced the flow diagram to computing in 1948, they imagined a clean division of labor.3 A skilled mathematician or scientist – understood to be male – would do the »head work«: conceptualizing the problem, performing the analysis, designing the algorithm. The product of that intellectual labor would be the flow diagram. A »coder« would then perform the »hand work« of translating the diagram into machine instructions, a task von Neumann and Goldstine confidently expected to be »perfectly routine,« requiring only »a moderate amount of experience« to strip of all difficulty. In the early computing projects they had in mind – ENIAC and its successors – this clerical labor was assigned to women. The blueprint was the program. Everything downstream was transcription, and transcription was women’s work. The flowchart thus encoded, from the very beginning, a hierarchy of intellectual value that mapped onto existing hierarchies of gender and status: the analyst thought, the coder typed, and the diagram marked the boundary between them.
This hierarchy did not merely replicate gender distinctions; it reinforced and extended a broader set of racial and class divisions as well. In the United States, the early programming workforce was disproportionately white, and the barriers to entry – formal credentials, professional networks, access to institutional computing resources – functioned as filters that reproduced existing social inequalities. As the industry expanded globally through the 1970s and 1980s, the logic of the flowchart as a tool for disciplining and deskilling labor traveled with it. If a process could be fully specified in advance, in a diagram that anyone could read, then it could also be performed elsewhere – by lower-wage workers in India, the Philippines, Ireland, or any number of emerging technology economies.
The offshore outsourcing of software work that accelerated in the 1990s was premised on exactly the fantasy that von Neumann and Goldstine had articulated in 1948: that programming could be divided into intellectual design work, retained in high-cost metropolitan centers, and routine implementation work, exported to cheaper labor markets. The flowchart, or its successors in the form of detailed functional specifications and structured methodologies, was the instrument by which this division was enforced.
This is precisely the fantasy now being revived in the suggestion that artificial intelligence is on the verge of replacing the software developer: that software is essentially a specification, that a specification can be made complete and correct in advance, and that the generation of code from it is a routine downstream task – now to be performed by a machine rather than a low-status human coder. The history of the flowchart is the long record of why this premise fails. Specifications were never complete, because the problems that mattered were never fully formulated before someone began to build. They were never stable, because software is the rare technology that must be constantly maintained even though it never physically wears out – and maintenance is, at bottom, a problem of communication between programmers and managers, between one programmer and the next, and between a programmer and his or her own future self.
The flowchart survived its own obsolescence as a design tool by quietly becoming a documentation tool: a way for humans to communicate with other humans across space and time, drawn in pencil on cheap paper with a plastic IBM template you could hold in your hand. It was, in the most literal sense, material – and so was the work it organized. To say that software is made of paper and templates and meetings and arguments, not only and not even primarily of code, is not a metaphor. It is a description of how software has always actually been built.
The materiality of software has another dimension that has become impossible to ignore. Computing has always had an environmental footprint, but the scale of that footprint has grown to planetary proportions that the programmers of the 1960s could not have imagined. The data centers that store and process the world’s digital information consume enormous quantities of electricity and water; the supply chains that produce the hardware run through some of the most environmentally and socially precarious regions on earth. The »cloud,« which likes to present itself as weightless and immaterial, is in fact a factory – one of the most energy-intensive and resource-demanding industrial systems ever constructed.4 This connection to the history of the flowchart is direct: the fantasy of software as pure thought, as algorithm untethered from physical substrate, has consistently obscured the material costs of computing at every scale.
Now, as AI systems promise once again to automate the routine work of code generation, it is worth noting that the energy demands of large-scale AI training and inference are orders of magnitude greater than those of conventional software. The dream of frictionless automation has always had a price. What is new is not the price but the scale at which it is now being paid – and the degree to which its costs, environmental and human alike, continue to be rendered invisible by the same fantasy of immateriality that produced the flowchart in the first place.
This is why the flowchart still matters, and why its persistence is more than a curiosity. Martin Goetz, who built Autoflow, the first commercial software product, out of a program for reverse-engineering flowcharts from finished code, liked to say that »like most strong programmers, I never flowcharted; I just wrote the program.«5 He was right about himself and wrong about the flowchart, whose value never depended on its accuracy. The same diagram that was a useless blueprint was an indispensable contract, an effective training device, and – when Goetz used one to describe an algorithm in a patent application in 1968 – a piece of legal documentation, the basis of the first software patent ever granted. The technology did not change; it was simply imagined, and put to work, differently by different communities. That interpretive flexibility was its conscriptive power.
For the historian, the many liabilities of the flowchart – that it was imperfect, imprecise, mutable, and endlessly contested – turn out to be virtues. A correct flowchart would tell us only what a program did. An incorrect one, fought over and revised and quietly produced after the fact, tells us who was supposed to do the thinking and who the typing, which boundaries were being defended and by whom, and how the inequalities built into computing from its earliest days were sustained, naturalized, and occasionally challenged. Like all maps, the flowchart offered only a selective and interested perspective on reality. Read against the grain, it lets us see software as it actually is: not a body of code awaiting its author, but a sociotechnical system in which the question of who does which work – and whose work counts – was never settled once and for all.
Footnotes
-
1
The original version of this article appeared as Nathan Ensmenger, The Multiple Meanings of a Flowchart, in: Information & Culture 51 (2016), no. 3, pp. 321-351. It has been updated and expanded for this version.
-
2
Susan Leigh Star/James R. Griesemer, Institutional Ecology, »Translations« and Boundary Objects: Amateurs and Professionals in Berkeley’s Museum of Vertebrate Zoology, 1907-39, in: Social Studies of Science 19 (1989), no. 3, pp. 387-420, online https://lchc.ucsd.edu/mca/Mail/xmcamail.2012_09.dir/pdfuaCxVBhVe5.pdf.
-
3
John von Neumann/and Herman H. Goldstine, Planning and Coding of Problems for an Electronic Computing Instrument, Institute for Advanced Study, Princeton, NJ1947, online https://www.ias.edu/sites/default/files/library/pdfs/ecp/planningcodingof0103inst.pdf.
-
4
Nathan Ensmenger, The Cloud Is a Factory, in: Thomas S. Mullaney/Benjamin Peters/Mar Hicks/Kavita Philip (eds.), Your Computer Is on Fire, Cambridge, MA, pp. 29-50.
-
5
Martin Goetz, Memoirs of a Software Pioneer: Part 1, in: IEEE Annals of the History of Computing 24 (2002), no. 1, pp- 43-56.
License